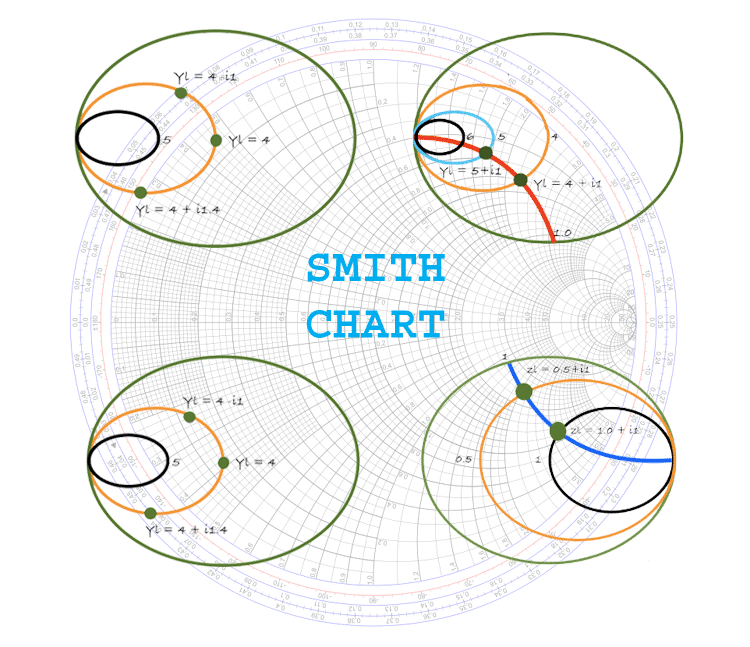

This was a highly simplified description, to give an operational understanding of how plotting your measured impedances on a Smith chart can give a great visual of how well the antenna system is tuned. In these days of increased noise floor with interference from power company insulators, LED lights, switching power supplies in almost every electronic device, it’s probably more critical than ever when it comes to operating an AM station. The better the antenna system is set up, the further and cleaner the signal will be. This is a lesson we learned way back when directional antenna systems were first developed, it was reinforced in the days of AM stereo and it’s equally important for HD Radio technology – but it also applies to non-directional analog mono signals. The corollary I use is that the antenna is to the RF transmission facility what the speakers are to a hi-fi system… the best amplifier (transmitter) in the world isn’t going to perform well into a bad speaker (antenna) system. It means that your signal will behave similarly both above and below carrier, so the sidebands are well matched – leading to improved signal quality and typically better coverage.

This provides the most balanced load and is probably more critical to proper signal transmission, whether analog or digital, than the actual carrier frequency load impedance. What’s shown in the example above, courtesy of our friends at KOTZ (thanks, Pierre!) is a good example of what’s called Hermitian symmetry – the reactance above carrier is equal and opposite to the reactance the same spacing below carrier. Since the AUI sweeps from -15kHz to +15kHz from carrier, we’d only be able to step right from -15kHz, as that’s an end point. We can then use the blue left and right arrows at the right of the title bar to step through the frequencies that were swept. So, for example, on the picture shown above, if we were to click on the lower end of the arc, it might say, “Impedance: 1.05 – j1, Frequency: -15kHz”, representing the deviation from normalized 50, j0 impedance and carrier frequency.
#The smith chart series
With the Smith chart reading provided in the AUI of our NX series AM transmitters, you can click on the sweep (the red arc) at any point and the reading in the upper corner of the screen will show you the frequency offset from carrier, as well as the deviation from 50, j0. In this case, we can see that at the lower end, the impedance is roughly 50.05 -j1, passing through nearly 50 ohms at the midpoint, and approaching roughly 50.05 +j1 at the upper end. Photo courtesy of Pierre Lonewolf, KOTZ Kotzbue, AK The Smith chart is one of the easiest ways to get an “at a glance” characterization of a complex impedance across a range of frequencies, once you have a basic understanding of what it is measuring. caliber lightning storm, a very rare event in this part of the world! Fortunately, other than some temperature issues at the station I assist with and an internet outage periodically during the storm, we made it through just fine – we certainly saw record-breaking numbers for this time of year, though!Īs part of the event, I ended up spending a bit of time looking at the AUI for the VS1 at our local station and it reminded me of a couple of requests that have come in over the past few months, so this issue, we are going to talk about those things.įirst, I got a request to make a bit of a dive into what we’re looking at when we view a Smith chart. That ended this morning with a midwestern U.S. Hey folks – summer is upon us here in the great green North… the past few days we have been under a heat warning, which happens here any time the mercury climbs above 30 degrees Celsius, or about 85° F.


 0 kommentar(er)
